Descriptive Statistics For this tutorial we are going to use the auto dataset that comes with Stata. To load this data type The auto dataset has the following variables. Suppose we want to get some summarize statistics for price such as the mean, standard deviation, and range. We’ll use the summarize command. Now let’s addContinue reading “Stata: Descriptive Statistics – Mean, median, variability”
Tag Archives: Tutorial
Stata: Introduction to the Interface
Stata: Scatterplots and Histograms

In this post I’ll show you how to: Create a basic scatterplot for examining the relationship between two variables. Add a lowess smoother to a scatterplot to help visualize the relationship between two variables. Create a histogram to look at your data. Basic Scatterplots In this post we’ll use the auto dataset. Creating a ScatterplotContinue reading “Stata: Scatterplots and Histograms”
Stata: Multiple Regression and Partial and Semipartial Correlations

This post will: Show how to extend bivariate regression to include multiple predictor variables. Show how to manually create partial and semipartial correlations using residuals from a regression model. Show how to use the pcorr command to obtain partial and semipartial correlations. Multiple Predictors We will again use the auto dataset. Suppose we want toContinue reading “Stata: Multiple Regression and Partial and Semipartial Correlations”
Stata: Repeated Measures ANOVA

The example for this post comes from Warner, R.M. (2008) Applied Statistics: From Bivariate to Multivariate Techniques. Thousand Oaks, CA: Sage — Chapter 20. The example data come from an experiment in which a researcher examines the effects of four stress conditions on heart rate on N=24 subjects. The four stress conditions are: Baseline PainContinue reading “Stata: Repeated Measures ANOVA”
Stata: Correlation and Covariance

This post will illustrate how to: Create a correlation matrix of variables using the correlate command. Display a correlation matrix as a covariance matrix. Obtain the statistical significance of a correlation using the pwcorr command. Correlation Matrix We’ll use the auto dataset for this tutorial. We’ll create a correlation matrix of four variables — price,Continue reading “Stata: Correlation and Covariance”
Stata: Graphing Distributions
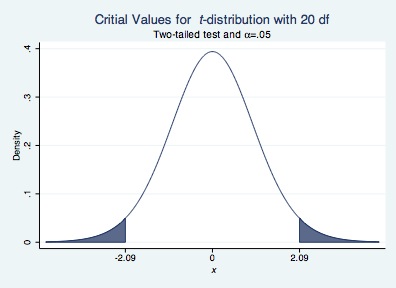
Graphing Distributions This post will demonstrate how: Use the `twoway function’ plotting command to visualize distributions Add colored shading to a graph to visualize portions of a distribution The twoway function command The twoway function plotting command is used to plot functions, such as y = mx + b. If we want to plot theContinue reading “Stata: Graphing Distributions”
Stata: Transparency in Graphs
Stata 15 includes the ability to add transparency in graphs. What’s transparency you ask? Transparency is relevant when you have graphical elements that overlap. Without any transparency the element that is in front will completely obscure any elements behind it. Transparency solves that problem. Suppose you want to plot two normal distributions. You can useContinue reading “Stata: Transparency in Graphs”
Stata: Bivariate Regression
In this post we’ll use the system dataset auto. To estimate the model we use the regress command in the command window. The regress command follows the general format of regress dv iv, options. Type help regress or visit the online help for regress for a description of the options available for regress. For exampleContinue reading “Stata: Bivariate Regression”
