Descriptive Statistics
For this tutorial we are going to use the auto dataset that comes with Stata. To load this data type
sysuse auto, clear
The auto dataset has the following variables.
describe

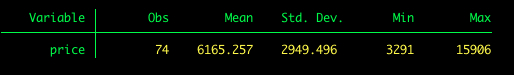
Suppose we want to get some summarize statistics for price such as the mean, standard deviation, and range. We’ll use the summarize command.
summarize price
Now let’s add the option detail to summarize. This will give us lots more information, including the median and other percentiles.
summarize price, detail

Multiple Variables at Once
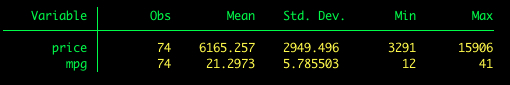
To get descriptives for multiple variables at once just add the variable names after summarize.
summarize price mpg
Adding the detail option.
summarize price mpg, detail

Using by processing
Suppose we want to get the descriptive statistics for price by car type (foreign vs domestic). We can use what is called by processing.
by foreign: summarize price

When using the by command, the variable of interest needs to be sorted in the data set. For example, in the previous example the variable “foreign” is already sorted within our data set. If we wanted to examine the price by mpg, we would need to sort miles per gallon. One way to sort data is using a simple sort command followed by the variable name. Stata will sort the data in ascending order by default.
sort mpg
After we sort the data, we can then use the standard by mpg: command. In by processing, we can also sort the data and execute the by command at the same time using the bysort command:
bysort mpg: summarize price
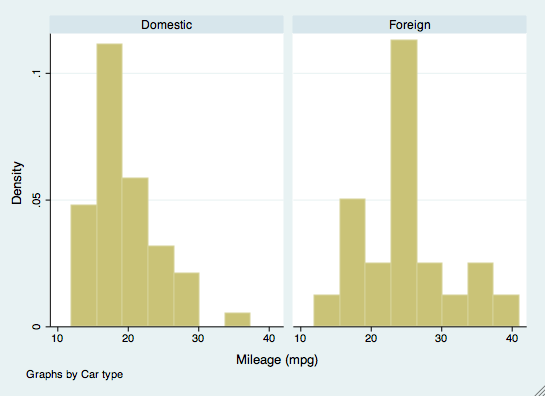
The by command can also be used in other commands, such as creating graphics. For example, if we wanted to examine histograms of mpg by the make of the car, we would use the by command as an option. The make of car does not have to be sorted for this command.
histogram(mpg), by(foreign)
Using if
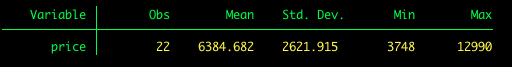
The by statement will give us descriptives for all levels of the by variable (i.e., both foreign and domestic). Suppose we just want the describes for one level of the by variable. We can use the if statement for that. For foreign cars (i.e., foreign == 1):
summarize price if foreign == 1
For domestic cars (i.e., foreign == 0)
summarize price if foreign == 0

This table is to help in determining how to specify what levels of the variable you want to use.
Symbol |
Meaning |
| == | is or is equal to |
| != or ~= | is not or is not equal to |
| > | is greater than |
| >= | is greater than or equal to |
| < | is less than |
| <= | is less than or equal to |
| *From pg. 74 of A Gentle Introduction to Stata by Alan Acock | |
Using in
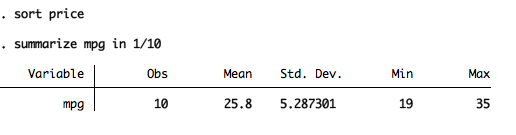
The in qualifier specifies a particular subset of cases based on their order in the dataset. For example, if we want to examine the mpg in the 10 least expensive cars, we would use the in command.
sort price
summarize mpg in 1/10
As a helpful hint for any of these processes, if your variables are labeled (showing the label instead of the numeric value) and you need to find the numeric values to examine levels of the variable, you can use the nolabel option.
browse, nolabel
This will show you the number values for variables. You can also find those values by double-clicking on them in the data browser.
